CSC 551: Web Programming
Fall 2001
HW4: Java Applet Programming
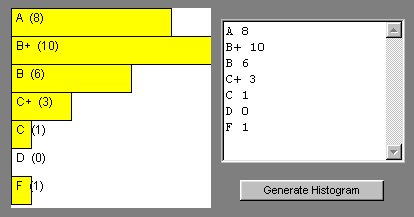
The Histogram class defines an applet for drawing histograms in a Web page. The idea is to have the user enter data in a textarea and then submit that data to the Histogram applet. The applet code will then parse the data and display the corresponding histogram. For example, the following screenshot shows a histogram of grades received by a student:

An HTML document that would produce this page is listed below:
|
<html>
<!-- Dave Reed Histogram.html 11/1/01 -->
<head>
<title>Histogram Page</title>
</head>
<body bgcolor="gray">
<form name="HistoForm">
<table align="center">
<tr><td>
<applet name="HistoApplet" code="Histogram.class" height=200 width=200>
You must use a Java-enabled browser to view this applet.
</applet>
</td>
<td align="center">
<textarea name="data" rows=8 cols=20 wrap="virtual"></textarea>
<p>
<input type="button" value="Generate Histogram"
onClick="document.HistoApplet.drawHistogram(document.HistoForm.data.value);">
</td>
</tr>
</table>
</form>
</body>
</html>
|
Part 1
Copy the source for the Histogram class into a file named Histogram.java and compile it into byte code. Then create the Web page to serve as an interface for this applet.
To create and compile an applet using Visual J++, perform the following steps:
- Select Microsoft Visual J++ from the Programs Menu.
- A window titled "New Project" will appear. Select "Applet on HTML" under the "Web Pages" option in order to create a new applet project, and enter the name Histogram in the project name box. Also, enter the desired folder for storing the applet project, then hit the "Open" button.
- This will create a project with default files "Applet1.java" and "Page1.html". The first thing you must do is change the names of these files. Click on the + that appears in the Project Explorer window at the upper right. Then right click on each of the files and select rename to change the names to "Histogram.java" and "Histogram.html".
- You can then cut-and-paste the code for the Histogram class into your Histogram.java file.
- To compile the applet, select "Build" under the Build menu.
Cut-and-paste the HTML text above into your Histogram.html document and test its behavior.
Part 2
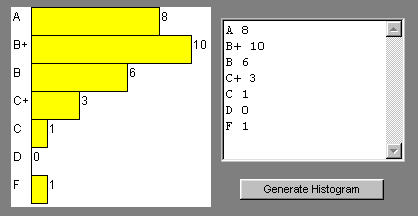
Currently, the labels for the histogram bars are displayed over the bars. While this is fine for long bars, the label text can be obscured by the edge of the bar if the bar is short (or the label is very long). Modify the histogram applet so that the label for each bar appears to the left of the bar, with the value for that bar appearing to the right. In order to allow enough room to the left and right of the bars, you will need to determine the maximum number of characters in a label, and also the maximum number of digits in any value. For example, given the grades data above, your applet would need to allow space for 2 characters to the left of the bars and 2 characters to the right. If there were labels with more characters or values with more digits, however, the applet ought to be able to adjust accordingly. After your modifications, the page would look like:

Useful hints: Currently, the code in drawHistogram traverses the data and finds the largest value. You will need to similarly traverse the data to find the longest label (using the string method length()). Once you know the longest label, you can multiply by the approximate number of pixels per character to determine the starting point for histogram bars. Similarly, you must determine the number of digits in the largest bar value and multiply by the number of pixels per character to determine the rightmost limit for histogram bars. In order to determine the number of digits in an integer value, a handy trick is to first convert the int to a string by concatenating it with the empty string "", then use the string method length() (e.g., numDigits = (""+number).length(); ).
When you are testing your code, be aware of the fact that browsers do not always reload applets when a page is reloaded. You may need to exit the browser completely (close all windows) then restart the browser in order to load changes.
Part 3
Add the Histogram applet to your GPA page so that, in addition to displaying the user's grade points, credit hours, and grade point average, it also displays the number of each letter grade in a histogram applet.


