This assignment is inspired by a Nifty Assignment created by Baker Franke (University of Chicago Laboratory Schools).
A topographic map is a two-dimensional representation of a terrain, usually utilizing contour lines to represent changes in elevations. A digital representation of a topographic map samples elevations at regular intervals, essentially representing the continuous terrain as a two-dimensional grid of discrete elevations. The National Oceanic and Atmospheric Administration maintains a large database of topographic maps, and even provides a free tool for generating digitized topographic maps.
Suppose you are given a digitized topographic map (i.e., a 2-D grid of elevations) and wish to cross the terrain moving from west to east (i.e., left to right). As a hiker, you might prefer paths that avoid large changes in elevation, since steep climbs or descents can be difficult. For this assignment, you will implement a greedy algorithm for choosing a path across a map, always selecting the next step that represents the smallest change in elevation. For example, consider the following 5x4 map:
    1000    1200    1150    1175

     900    1000    1100    1300

    1000    1100    1050    1350

    1200    1325    1400    1250

    1150    1100    1000    1100
If the hiker begins in the first column of the third row, she has three choices for the next step: moving northeast (from 1000 meters to 1000 meters), east (from 1000 meters to 1100 meters), or southeast (from 1000 meters to 1325 meters). Since northeast results in no change in elevation, the greedy approach will choose this step. From there, there are three choices for the next step: northeast (1000 → 1150), east (1000 → 1100), or southeast (1000 → 1050). The southeast choice represents the smaller change in elevation, so it is selected. Similarly, the last step will be southeast. If there are ever ties in the elevation changes, preference should be given to moving directly east. If the northeast and southeast options tie for the lowest elevation change, the choice whose row is closer to the center should be selected. For example, starting in the first column of the fourth row, the northeast and southeast choices have identical elevations. In this case, northeast would be selected, since its row is closer to the map center.
As is the case with many greedy algorithms, this approach is not guaranteed to find the least-cost path in terms of elevation changes. In this example, the path 1000 → 1000 → 1150 → 1200 would be better than the greedy path. However, the greedy approach is reasonably effective at generating good paths across the terrain.
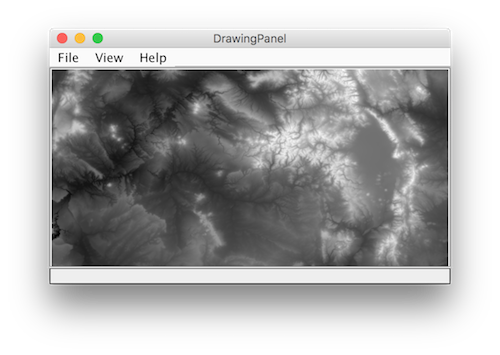
You are given two classes. The DrawingPanel class, written by Marty Stepp at the University of Washington, can be used to draw images in a Java window. The TopoMap class is an incomplete but functional class for drawing topographic maps. For example, the screenshot below displays terrain from the Rocky Mountains in Colorado, with brighter shades corresponding to higher elevations.
TopoMap class contains a main method that reads in and displays a topographic map. Currently, the draw method assumes that the elevations will be between 0 and 9000 meters. Using that range, the elevations in the map are scaled to grayscale values in the range 0..255. For example, an elevation of 1000 meters would scale to 255*(1000/9000) = 28. Since most locations on earth are toward the bottom of 0..9000 elevation range, the resulting image will tend to be very dark. You are to add methods to the class that identify the lowest and highest elevations in the current map. Then, modify your draw method to scale the elevations to that range in order to get the maximum contrast when displaying the map. For example, the lowest and highest elevations in the above map are 900 and 1400 meters, respectively. This defines an elevation range of only 500 meters from low to high. Since 900 is at the bottom of that range, it would scale to a grayscale value of 255*(0/500) = 0. An elevation of 1150 meters would scale to a grayscale value of 255*(250/500) = 127. An elevation of 1400 meters would scale to a grayscale value of 255*(500/500) = 255.
Once you have modified the draw method to scale the elevations directly, you can test it on a variety of actual maps: small.dat, medium.dat, large.dat and huge.dat.
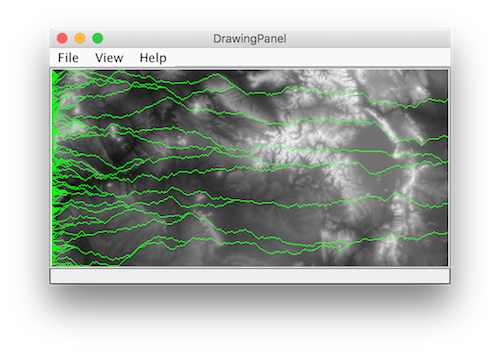
drawGreedyPath method, which takes a row number and a color (e.g., Color.RED or Color.GREEN), and displays the greedy path starting in column 0 of the specified row. To set the color and draw each pixel in the path, you will need to call the setColor and fillRect methods of the Graphics class. Example calls to these methods can be found in the draw method.
Once you have implemented this method, modify the main method so that, after drawing the map, it draws each greedy path (starting on the left of each row) in green. For example: