Name: _________________________________________
One of the ways that computers have transformed science and mathematics is through software simulations. A model of a complex process, such as the spread of a disease or climate change, can be developed and then studied to gain insights into that process that cannot easily be duplicated. For example, an epidemiologist studying the spread of a disease can change parameters in the model (e.g., rate of infection, degree of social distancing) and study how policy changes might impact the spread. In addition, software models can simulate extended periods of time very quickly, such as the impact of climate change over decades or centuries.
Chapter X8 included several examples of Web pages that modeled real-world systems. This lab will focus on the volleyball simulation page, volleyball.html. This page simulated a single volleyball game between two opponents, where the strengths of the teams and the game length was entered in text boxes. While this page was effective for seeing the point-by-point results of a single simulated game, it is not very useful if you wanted to simulate many games and generate statistics on the cumulative results. For this lab, you will modify the volleyball.html page and conduct experiments that will allow you to draw conclusions about competitive balance in volleyball.
As we saw in Lab 3, drawing conclusions from processes involving randomness requires a large number of repetitions in order to balance out statistical anomalies. If we want to simulate a large number of games and generate cumulative results, we will need to modify the volleyball simulation page.
EXERCISE 1: Download a copy of volleyball.html and make the following modifications:
- Add a line to the comment element at the top of the HTML document, acknowledging that you are modifying the original page. For example:
<!-- Modified by FIRSTNAME LASTNAME for CSC 121 Lab 4 -->
- Add a fourth text box to the BODY of the page, with the label "Number of games to simulate:". This is where the user will be able to specify the number of volleyball games that are to be simulated at the click of the button. The box should have a default value of 1000.
- Modify the existing
PlayGamefunction so that, instead of displaying the results of each point, it returns a string denoting the winner of the game. That is, after the game simulation is complete (i.e., after the while loop ends), it should check to see which team's score is higher. If team1's score is higher, meaning they won the game, the function should return 'team1'. Otherwise, the function should return 'team2'. Be sure to remove the statements that display the point-by-point scores, since we no longer care about the game scores - just the winner. Plus, unnecessary output will only slow down the simulations.- Define a new function named
PlayAllwithin the same SCRIPT element in the HEAD, and have the button call this function when clicked (instead of callingPlayGame). ThePlayAllfunction should access the desired number of games to simulate (from the new text box) and then loop that many times, calling thePlayGamefunction each time through the loop and counting the wins for each team. The while loop that simulates the games and keeps track of the number of wins or each team is provided below, with the code for initializing variables and displaying the winning percentages left for you.// CODE TO INITIALIZE VARIABLES while (gamesPlayed < desiredNumberOfGames) { winner = PlayGame(); gamesPlayed = gamesPlayed + 1; if (winner == 'team1') { winsForTeam1 = winsForTeam1 + 1; } else { winsForTeam2 = winsForTeam2 + 1; } } // CODE TO CALCULATE AND DISPLAY WINNING PERCENTAGES
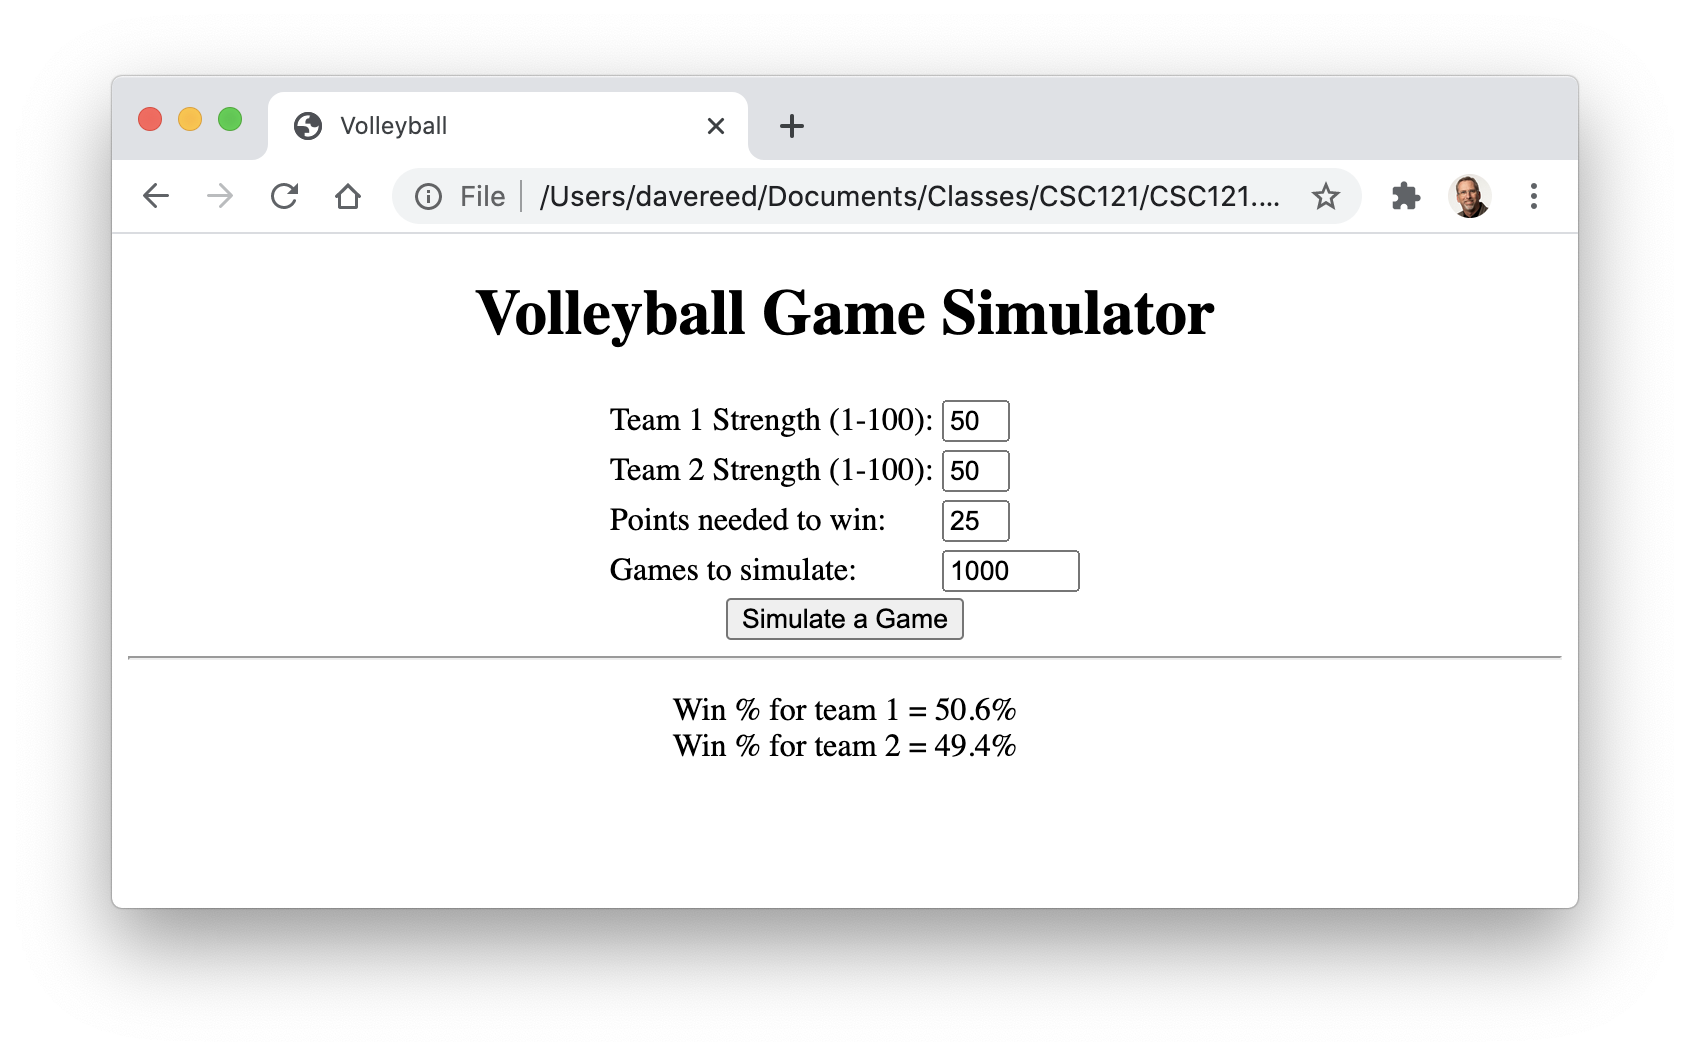
When completed, your page should simulate the specified number of games and display the winning percentages for the two teams, as shown below.
Test your modifications thoroughly to be sure that the desired number of simulations are performed and the corresponding winning percentages are displayed. Then, use your page to complete the following exercises.
EXERCISE 2: Suppose two evenly matched teams (i.e., teams with the same strength rating) play each other. Since they are equally likely to win any given point, it makes sense that they should have the same likelihood of winning a game. Use your page to confirm this. Set the strengths of both teams to 40 with a game length of 25. Simulate 1,000 games and list the winning percentages of the two teams below. Is it close to 50/50?
Conduct 9 more experiments with the same settings (team strengths of 40, game length of 25, 1,000 games). List the results below. Are they all close to 50/50? How consistent are the results (using the relative difference between the smallest and largest percentages, as in Lab 3)?
EXERCISE 3: Suppose one of the teams is slightly better than the other. For example, if team1 had a strength of 44 and team2 had a strength of 40, then team1 would have a 10% higher chance of winning any given point. You might be tempted to think that a 10% advantage on a point would translate to a 10% advantage on winning a game. However, the truth is that even a small advantage compounds over the course of the game. Conduct 10 experiments with team strengths of 44 and 40, assuming a 25 point game and 1,000 games per experiment. Report your results below. How consistent are the results (again, using the relative difference measure)? How far from 50/50 are the results?
Increase the number of games to 10,000 and perform another 10 experiments (using the same game settings). Report your results below. Are the results more consistent than the results from 100 games? Should they be? Explain your answer.
EXERCISE 4: Fill in the following table by performing simulations with yourvolleyball.htmlpage. For each pair of team strengths, perform three different experiments and report the winning percentage for team1. Assume that for all of these, the game length is 25 and the number of games is 10,000.
team1 strength team2 strength Experiment 1
team1 win %Experiment 2
team1 win %Experiment 3
team1 win %44 40 48 40 52 40 60 40 80 40 Describe the overall pattern shown by your results. As the difference between the team strengths increases, how does the likelihood of the better team winning the game change? What does this suggest to you about the "fairness" of volleyball's scoring rules? That is, if one team is objectively better than the other, are they likely to win under these scoring rules? Explain.
EXERCISE 5: Suppose the team strengths change, but the same relative relationship holds. For example, a team with strength 44 is 10% better than a team with strength 40. Likewise, a team with strength 33 is 10% better than a team with strength 30. We would expect that the likelihood of winning depends only on relative strengths, not absolute strengths. Perform experiments and fill in the following table to help confirm this. As before, assume the game length is 25 and the number of games is 10,000.
team1 strength team2 strength Experiment 1
team1 win %Experiment 2
team1 win %Experiment 3
team1 win %33 30 36 30 39 30 45 30 60 30 Are the results you obtain similar to the results in the previous table (which used a baseline strength of 40). Justify your answer by comparing the results from the two tables.
EXERCISE 6: In college volleyball, the initial games in a match are played to 25. If the teams are tied at two games each, however, the deciding fifth game is played to 15. An interesting question is whether this shortening favors either of the teams. Repeat the simulations you performed in EXERCISE 4, only now with a game length of 15. Assume the number of games for each experiment is still 10,000.
team1 strength team2 strength Experiment 1
team1 win %Experiment 2
team1 win %Experiment 3
team1 win %44 40 48 40 52 40 60 40 80 40 Does the shorter game tend to favor the better team or the underdog? Hint: compare the results from this exercise with those from EXERCISE 4. Is the effect heightened if the differences between the two teams is greater? Identify any pattern that you see in the results, and provide a rationale for why that pattern holds.
volleyball.html page along with a file containing your data and answers to these exercises.